
Ottawa Real Estate Market - April Stats
April stats are in, and they are interesting!
April stats are in, and they are interesting!
Back again for our monthly market update, let's take a look first at how we look at April this year versus April last year, and then, like always we'll dive into what is going on month by month.
What are the trends that we're seeing in the market, and what are we expecting to see in the future.
So, April 2023, the average price of a home is $636,000, it's down about 7.5% from the same time last year. The Sold to List Price Ratio is 98.8%, down about 9.7% from the same time last year. The unit sold 1,848, down 21% from April 2022, and the Days on Market are up 153% sitting at 29.63 days. Now let's take a look at the total new listings and the inventory that we're seeing on the market.

So total inventory, we had 2,760 homes for sale at the end of April; that's up 62% from April of last year; the months of inventory are sitting at 1.9%; that's up 111% from last year; and new listings, we saw 2,144 new listings; that's actually down 25% from Maple of last year.
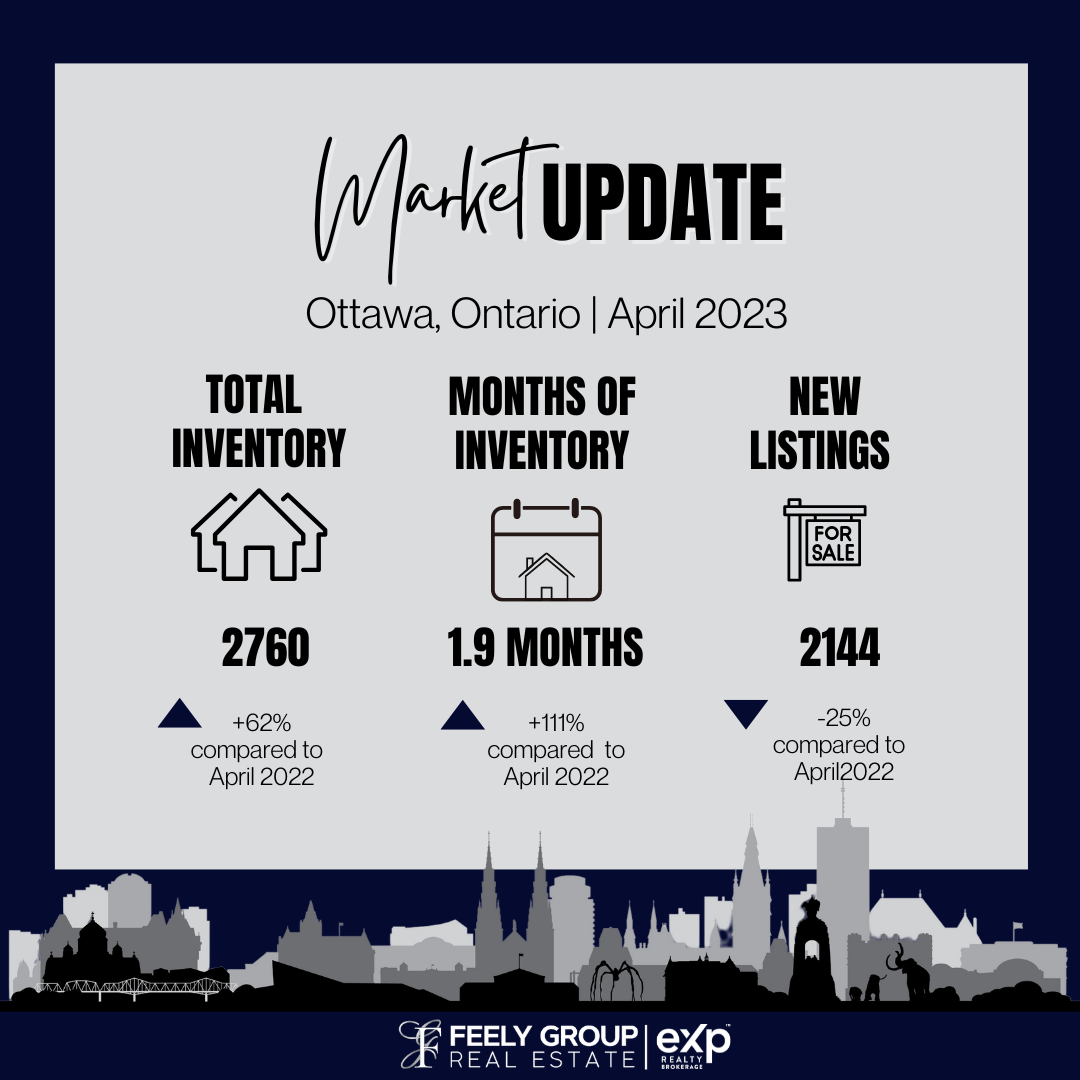
All right, so when we're looking at inventory, the big story here isn't that we're up 111% from April of last year when we were at all-time historic lows; the big story is that when we're sitting at 1.9% months of inventory on the market here, we've cut inventory in half from January, where we're sitting at 3.8% months, and March, where we're sitting at 2.5% months, and so while sales are still down 20% from the same time last year, we're not seeing enough homes hitting the market, and what does that mean?
The market is starting to heat up. We're starting to see bidding wars again, and we're starting to see the prices come up.
So let's take a look at the overall prices, month by month. So taking a look at the average prices month by month, you can take a look at the right-hand corner, and you see that the ROI is -7.5% from April of last year.

However, the market is actually up 12% from its low in December. Now let's back it up and look at the average home prices since 2021. So now, if you look at the top right-hand corner, you'll see the ROI is 17%. So if you bought a home in January of 2021, you've actually made 17% return on your investment and you
can see from the 636 where we're sitting now, we're above all of the 2021 numbers, which for the last few months of 2022, we were significantly under.
And now let's take a look at the days on market, another reason why I love to look at it month by month and not just year over year because it paints a completely different picture. So yes, the days on market are up 153% over the same time last year, but 11.5% days for a home to sell is not sustainable.

The bigger story again is that January saw 47.5 days when it was taking it home to sell; it's down 37% to where it sits today over the last 4 months.

And next, we take a look at the Sold to Asked Ratio. So we're taking a look at the Average Sold to Asked Ratio of April 2022, you can see that it was almost sitting at 110% of asking price, but for those who don't know a lot of sellers back then were purposely underpricing their homes because they were guaranteed bidding wars, and they were going significantly over asking, but closer to the value. Now we're seeing homes priced more appropriately, and they're almost selling at 99% of asking price. Again telling us that the market is heating up. So anyone who's been following my videos for the last couple of months knows that the number that I'm most closely watching is actually the unit sold, because the unit sold is what we're seeing about a 40% drop starting May of last year.
So now let's take a look at the units sold. So taking a look at the units sold, we are down 21% from the same time last year. You can see that we sold more homes in April than we have since June of last year, making it the most homes we've sold in the last 9 months. And here's a look at the units sold for the last 5 years. You can see that starting in May and last year in the green line, we saw significantly less home selling, and we started out this year. The black line is selling a lot less homes as well, but we are starting to approach normal numbers again. And you might look at that and say, "well we're still selling significantly less homes, so how is the market heating up?"
The next graph is going to paint a better picture of why we're seeing a shortage of inventory and why the market's heating up so much. So this graph is going to show us the new listings by week over the last 5 years. If you take a look at that light blue line that represents 2023, you'll see that we're having about the
same amount of homes hidden in the market as usual for the beginning of the year, and if we take out the orange line that represents 2020, you can see that we're seeing significantly fewer homes hit the market than we saw in 2019, 2021, and 2022. In fact, in April of these years, you saw over 800 homes a week hit the market.
Well, in April of this year, we saw just around 600 per week, so while the number of homes sold is down 21% over the same time last year, the number of new listings is down over 25%, which is causing the inventory shortage and the market to heat up.
So while the average price in the days on market and the sold to asked ratio are great numbers to follow, you guys know that I've been following the units sold most closely, but now I'm also going to be following the amount of new homes that we're seeing hit the market. These two numbers combined are going to be the biggest factors in what we're going to see in the market going forward.

I think we're going to see a lot more homes hit the market. A lot of people who couldn't sell their home over the last 9 months might see an opportunity for them to get the price that they wanted. So yes, if you are a
seller watching this, looking for the right time to sell, it might just be now. Now I also want to give a bit of a disclaimer; it's something that might get overlooked because we're looking at the average price of all property classes across Ottawa, but if you're looking at condo buildings compared to luxury homes, compared to entry-level Town Homes, these are all very different markets, also depending where you're
looking in the city. The different pockets have different things going on. So if you're interested in knowing exactly what's going on with the specific property type in the city, then you want to double check that it is correlating with the overall market, or you can always send me a message at 613-325-9107.
I'm happy to help you figure it out. Like always, I hope you guys find this blog helpful.
Let me know what your questions are about the real estate market. I'll make sure to write content about that
in the future.
I'm excited to see what happens next in the real estate market, and even more
excited to share with you guys.


